Suppose we want to predict the risk of developing a disease to a person or we want to predict whether a student will pass or fail in an exam by using data like how many hours he/she spends on daily study. Here comes the need of Logistic Regression. Then let’s get started !
Introduction
Logistic Regression actually denotes a classification algorithm. It is a statistical model that is used to predict a class or category based on the other features. It finds a relationship between the features and the predicted class in which they can fit in.
Suppose you want to predict whether a person with a tumor will survive or not and the given features include the age, sex, size of the tumor, and other factors regarding the person. Logistic regression is used to predict the probability of survival by using the given features.

Generally Logistic Regression can be classified into two categories :
- Binary logistic regression
- Multinomial logistic regression
Binary consists of two output classes whereas multinomial consists of more than two classes.
But why not Linear Regression ?
The question arises that can we use linear regression to predict the classes using the given features.
Suppose we want to predict whether a tumor is malignant (“1”) or benign (“0”) based on the size. So let’s fit a linear model on size vs class ( 0 or 1 ).

The threshold that can be set to classify the output can be 0.5. If hΘ(x) >= 0.5 then predict y=1. If hΘ(x) < 0.5 then predict y=0.
But there is a problem with this approach. If we have another tumour size that is surely malignant and then we fit the linear model including this size too then the line shifts towards this new included point and the boundary also shifts. This makes the point that was earlier classified as malignant to be predicted as benign and this is not at all good :(
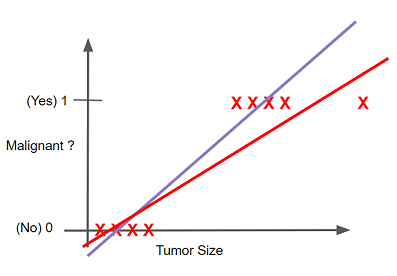
There is also another problem. For classification, we need values of y i.e. the prediction to be between 0 and 1 as the probability cannot be less than 0 and greater than 1. But in linear regression the values less than zero and greater than 1 are also possible.
Logistic Function
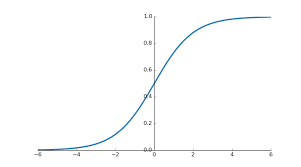
To deal with the problems stated in using linear regression we use a different function for logistic regression. With linear regression, we had hΘ(x) = ΘTx , but for the logistic regression we take hΘ(x) = g(ΘTx) where the

g(z) is known as sigmoid or logistic function. By using this function we get g(z) → 0 as z → −∞, g(z) = 0.5 if z=0 and g(z) → 1 as z → ∞. And thus for Logistic Regression we get 0 < hΘ(x) < 1.
Interpretation of hΘ(x)
In terms of conditional probability, hΘ(x) denotes P(y=1 | x) i.e. the probability of y being 1 given the features x.
Suppose we have x = [x0 x1] = [1 Stumour] and hΘ(x)=0.7 then this means that there is 70% chance of tumour being malignant given the size S of the tumour.
However there is an alternate notation for the hΘ(x).
hΘ(x)=P(y=1 | x; Θ)
This denotes the probability of y being 1 given the features x and parameterized by Θ.
The possible values for y can only be 0 and 1. By law of probability we can write that
P(y=1 | x; Θ) + P(y=0 | x; Θ) = 1
Decision Boundary
Decision boundary is a function of the regression parameters Θ, derived from training data. Let us understand this by an example. Suppose we have some data points like given in the figure
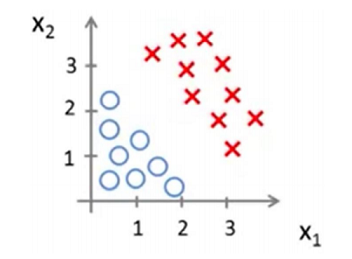
After training the Logistic model on the dataset, we have Θ to be [-3 1 1]T. Now we know from the logistic function that hΘ(x) = 1 if ΘTx > 0 i.e. -3 + 1.x1 +1.x2 > 0 or x1 +x2 > 3.
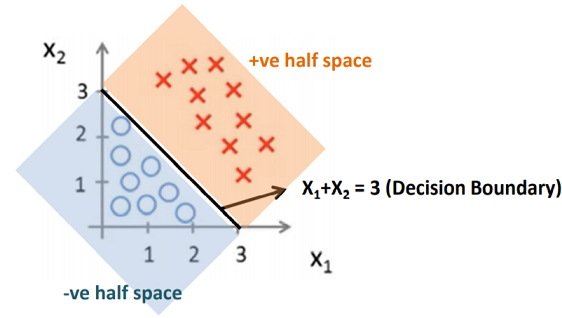
Decision boundaries are not always clear cut. That is, the transition from one class in the feature space to another is not discontinuous, but gradual.
But suppose we have a dataset that looks like this
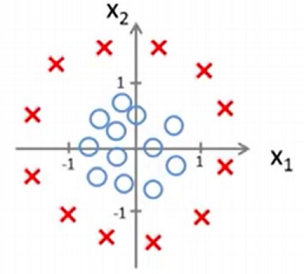
Here we cannot separate these by a linear decision boundary but it can be done by a non-linear decision boundary.
For that let

This means we are transforming our 2D space to a 5D feature space. Assigning Θ0 = -1, Θ1 = 0, Θ2 = 0, Θ3 = 1, Θ4 = 1. Then, hΘ(x) = 1 if -1+ x12 + x22 ≥ 0 => x12 + x22 ≥ 1.
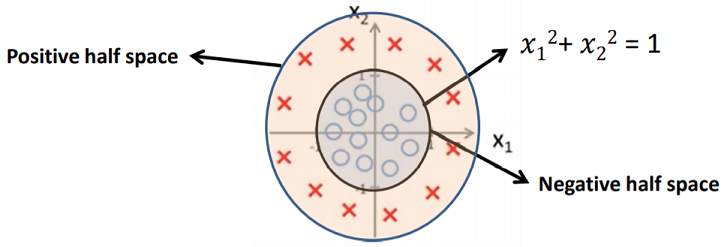
However more complex decision boundaries are also possible depending on our chosen feature space.
Cost Function
We previously saw that we cannot use linear regression for classification problem but can we use the cost function of linear regression for our logistic function. So let’s see what happens if we use linear regression cost function

What we get is this
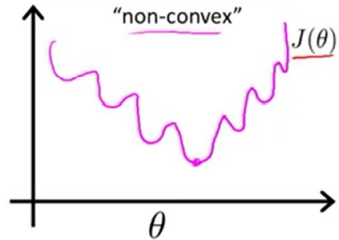
We cannot use gradient descent on this non-convex function because it may lead to getting stuck in a local minimum.
The solution for this problem is to define a new cost function for Logistic Regression

We can see that if our y=1 but predicted y is close to zero then we get a very huge error so this cost function is good and we will use gradient descent to decrease this error.
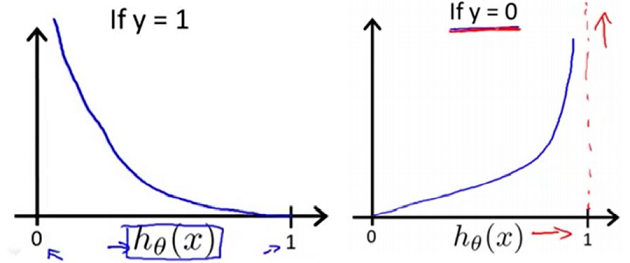
Now rewriting the cost function we get

Now we can apply gradient descent on this cost function to get the best fit parameters.
But logistic regression is not just limited to data points. We can even classify images and audio based on the pixels and audio samples. Scikit-Learn is a python library which allows us to implement Logistic Regression with just 2-3 lines of code.
So get started and thanks for reading :)